
Enterprise Web Operations Dashboard
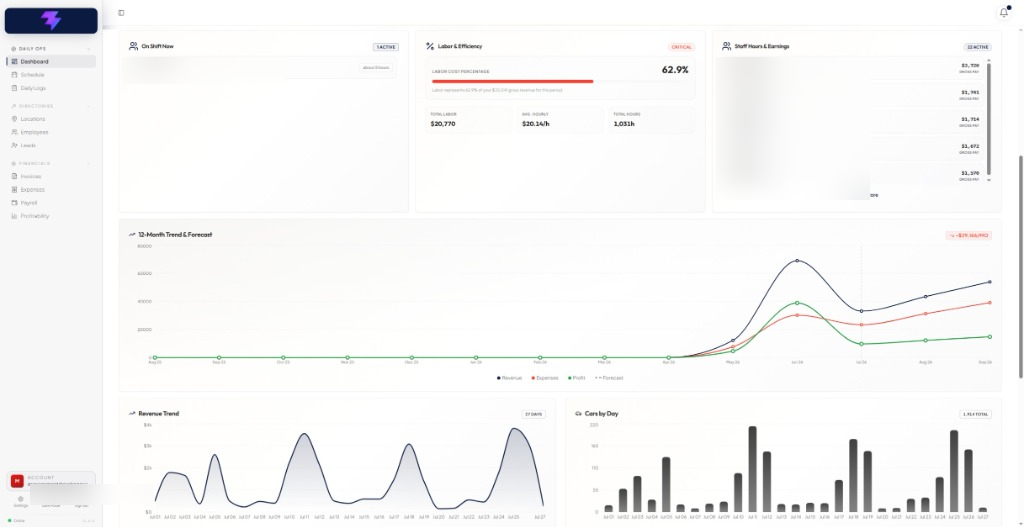
Built for enterprise-scale operations
Executive KPI Monitoring
Real-time tracking of operational KPIs including net profit margin (32.6%), labor cost percentage (62.9%), and gross revenue velocity.
Profitability Scorecards
Automated branch & location profitability rankings, margin health scores, and operational cost ratio scorecards.
Invoicing & Client Billing
Automated invoice generation, payment processing integration, and ledger reconciliation for accounts receivable.
Employee Shift Scheduling
Drag-and-drop shift calendar builder, manager shift approvals, and automated schedule publishing to staff.
Live Clock-In / Clock-Out
Real-time employee attendance tracking, mobile timeclock telemetry, shift hour logging (1,031h), and timecard auditing.
Staff Payroll Leaderboard
Live tracking of active on-shift personnel (22 active staff), individual gross pay counters, and payroll exports.
Unmerged Report Queue
Smart alert engine identifying pending location report logs (e.g. 4 pending reports) with 1-click ledger merging.
12-Month Forecast Curves
Multi-curve historical revenue trend analytics ($0–$4k/day) and predictive monthly run-rate forecasting.